How 3D Mapping Transforms Disaster Understanding in Japan
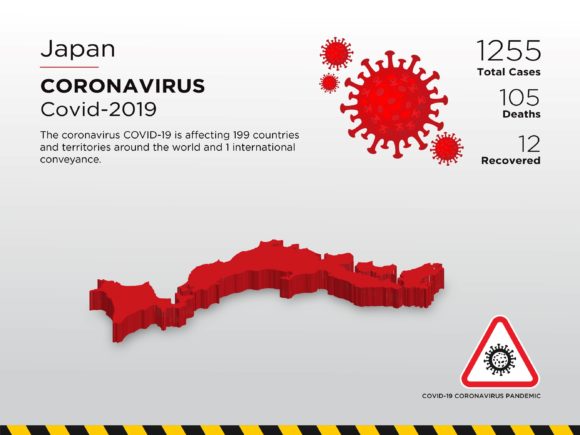
When a researcher pulls up the Japan Affected Country 3D Map for the first time, the sheer visual impact is immediate. Flat, two-dimensional charts of seismic zones or tsunami inundation areas give way to a textured landscape where elevation, fault lines, and urban density coexist in a single, rotatable view. This kind of tool changes not only what we see but how we interpret risk, response, and recovery in one of the most seismically active nations on Earth.
The Japan Affected Country 3D Map is not a single product but a category of geospatial visualizations that layer historical disaster data over digital elevation models. These maps cover everything from the 2011 Tōhoku earthquake and tsunami to volcanic eruptions, typhoon paths, and nuclear exclusion zones. What makes them distinct is the vertical dimension: by rendering terrain and infrastructure in three dimensions, they reveal relationships that contour lines and color gradients can only hint at.
Why Three Dimensions Matter for Disaster Data
Traditional maps flatten reality. A coastal plain that appears as a uniform green patch on a 2D map might actually slope gradually inland, a critical detail for tsunami wave propagation modeling. The Japan Affected Country 3D Map captures those subtle elevation changes, allowing viewers to trace how water would flow, where debris might settle, and which evacuation routes remain viable. This depth perception is not a luxury; it is a functional necessity for anyone studying or responding to natural hazards in Japan.
For geologists and seismologists, the 3D representation of fault systems around the Pacific Ring of Fire becomes far more readable. Subduction zones, where the Pacific Plate dives beneath the Okhotsk Plate, appear as dramatic topographic breaks. The Japan Trench and Nankai Trough are not abstract lines on a paper map but visible scarps in the seabed and coastal margins. Researchers use these visual cues to identify areas of accumulated strain and to communicate risk to non-specialists.
Urban planners and local government officials have adopted these maps to visualize the intersection of population centers with hazard zones. A 3D view of Tokyo Bay, for instance, shows not only which wards sit on reclaimed land but also how building heights and transportation networks relate to projected liquefaction zones. The Japan Affected Country 3D Map becomes a planning tool for zoning ordinances, retrofit priorities, and emergency shelter placement.
Practical Workflows for Professionals and Researchers
For a hazard mitigation specialist, the typical workflow begins with importing recent seismic and topographic datasets into a 3D visualization platform. The Japan Affected Country 3D Map might be built from LiDAR scans, satellite imagery, and historical damage surveys. Once the base model is loaded, the user can overlay event-specific layers: shaking intensity from the 1995 Kobe earthquake, flood depth from Typhoon Hagibis in 2019, or radiation readings from the Fukushima Daiichi incident.
One of the most powerful features is time-slider functionality. When a researcher animates the spread of a tsunami across a 3D coastal model, they can see not just the maximum inundation zone but the sequence of wave arrival, backwash, and secondary surges. This temporal dimension, combined with terrain elevation, helps refine evacuation timing and shelter elevation requirements.
Educators at universities and technical colleges use the map to bridge theory and observation. A lecture on plate tectonics becomes tangible when students can rotate a 3D section of the Japan Trench and measure the angle of subduction. A class on disaster preparedness can simulate different earthquake magnitudes and watch how slope failures propagate through mountain communities. The Japan Affected Country 3D Map serves as a shared reference point that replaces abstract numbers with spatial intuition.
For journalists and documentary producers, the map provides a way to explain complex disasters to a general audience without oversimplifying. A news segment on the 2024 Noto Peninsula earthquake can use a 3D flyover to show the remote valleys that were cut off by landslides, the coastline uplifted by the quake, and the temporary housing clusters that emerged. The visual narrative is self-explanatory in a way that text and still images struggle to match.
Data Sources and Accuracy Considerations
The reliability of any Japan Affected Country 3D Map depends on the quality of its underlying datasets. The Geospatial Information Authority of Japan provides high-resolution elevation data, while the Japan Meteorological Agency contributes seismic and weather records. International bodies like the United Nations Satellite Centre supply post-disaster imagery that can be draped over digital elevation models to show building damage or flood extent.
Users should pay attention to resolution. A map built from 10-meter DEM data is adequate for regional planning but may miss local features like levees, road embankments, or small hills that could influence hazard behavior. For site-specific analysis, 1-meter or better LiDAR data is necessary. The Japan Affected Country 3D Map is only as useful as the care taken in its construction. Layering outdated population figures over current terrain, for example, can produce misleading risk assessments.
Another consideration is temporal accuracy. Japan's landscape changes constantly through volcanic activity, coastal erosion, urban development, and post-disaster reconstruction. A map that does not account for the construction of seawalls after the 2011 tsunami will show a false vulnerability picture. The best models are living documents, updated with new survey data as conditions evolve.
Use Cases for Business Owners and Hobbyists
Business owners in Japan are increasingly turning to 3D hazard maps for due diligence. A real estate developer evaluating a site in Kanagawa can use the Japan Affected Country 3D Map to check flood risk from both sea-level rise and river overflow. An insurance underwriter can assess exposure concentration across a portfolio of properties, adjusting premiums based on elevation and proximity to known fault lines. The map turns vague anxiety about natural disasters into quantifiable spatial metrics.
Tourism operators in regions like Hakone or Kyushu use the maps to design safe excursion routes near active volcanoes. By visualizing exclusion zones and prevailing wind patterns for ashfall, they can inform guests without causing alarm. The 3D context helps explain why certain trails are closed and how monitoring stations are positioned.
Hobbyists and citizen scientists contribute to and benefit from these maps as well. Amateur seismologists use publicly available 3D models to track aftershock sequences and correlate them with topographic features. Model railroad enthusiasts recreate realistic disaster scenarios for educational displays. The Japan Affected Country 3D Map has even found a niche in gaming and simulation communities, where accurate terrain data makes virtual environments more authentic.
Educational Outreach and Public Awareness
One of the most underappreciated advantages of the Japan Affected Country 3D Map is its ability to communicate across language and literacy barriers. In a country with a significant international population and a culture of disaster preparedness, a visual tool speaks to everyone. Schoolchildren in Tokyo can compare the elevation of their own neighborhood with projected inundation zones. Foreign residents can understand evacuation routes without needing to read Japanese hazard brochures. The map becomes a common language for community resilience.
Museums and science centers have installed interactive 3D displays where visitors can trigger virtual earthquakes and watch the effects unfold across the Japanese archipelago. These exhibits generate empathy and understanding far more effectively than static posters. The Japan Affected Country 3D Map, in this context, is not just a reference tool but an engagement device that transforms passive information into active learning.
Local disaster management offices use printed or projected 3D maps during town hall meetings to discuss mitigation projects. When residents can see how a proposed seawall would alter the view and the wave energy distribution, they can make informed contributions to the planning process. This participatory approach builds trust and reduces conflict during implementation.
Considerations for Effective Use
Adopting the Japan Affected Country 3D Map requires some technical familiarity. Not all platforms handle large datasets gracefully; some require powerful graphics hardware or cloud-based rendering. Users should test performance before committing to a particular solution. File format compatibility matters as well. Common formats like GeoTIFF, OBJ, and KML are widely supported, but proprietary systems may lock data into a single ecosystem.
There is also a cognitive dimension to consider. While 3D maps are intuitive in many ways, they can also overwhelm users with too much information at once. Effective maps use selective transparency, color coding, and layer toggling to prevent visual clutter. A Japan Affected Country 3D Map that tries to show every fault line, every historical event, and every infrastructure element simultaneously will fail to communicate anything clearly. The best maps are designed with a specific audience and question in mind.
Cultural sensitivity is another factor. Areas affected by major disasters carry emotional weight. Showing a 3D model of a leveled town without context or purpose can feel exploitative. Users should always frame the map as a tool for understanding and prevention, not as a spectacle. The Japan Affected Country 3D Map should be presented with respect for the communities and histories it represents.
Future Directions and Emerging Technologies
Real-time data integration is the next frontier. Imagine a Japan Affected Country 3D Map that updates with live seismic readings, river gauges, and weather radar feeds. During an event, emergency managers could see not just the static hazard zones but the dynamic progression of a flood or fire. Early prototypes exist, but widespread adoption awaits better data standards and communication infrastructure.
Augmented reality applications are also appearing. A field worker with a tablet or AR headset could walk through a neighborhood and see the projected tsunami height overlaid on the actual buildings. This merging of digital and physical space could revolutionize drills and real-time decision making. The Japan Affected Country 3D Map becomes a layer of perception rather than a separate screen to consult.
Machine learning models trained on 3D terrain and historical damage data are beginning to predict which slopes are most likely to fail in future earthquakes. These predictions can be visualized directly on the map, giving planners a probabilistic risk surface rather than a binary hazard zone. The combination of 3D visualization and AI analytics represents a significant leap in disaster science.
Crowdsourced mapping is expanding the reach of these tools. Volunteers who collect GPS data, photograph damage, or report local conditions can contribute to community-maintained 3D models. These grassroots efforts sometimes fill gaps left by official datasets, especially in remote or rapidly changing areas. The Japan Affected Country 3D Map ecosystem grows richer with every contribution.
For anyone involved in disaster preparedness, research, education, or recovery in Japan, the 3D map is no longer a novelty. It is a necessary instrument for seeing the landscape as it truly is: three-dimensional, dynamic, and full of information that planar maps cannot convey. Whether used by a government agency planning a billion-dollar seawall or a hobbyist understanding the geography behind the news, the Japan Affected Country 3D Map provides depth in every sense of the word.